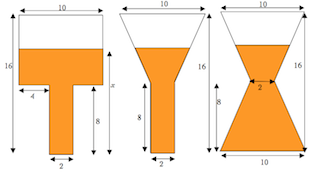
Doctor Dimension is a flat scientist who pours two-dimensional liquids into two-dimensional containers, thereby providing lessons on rate of change and piecewise functions, plus some review of similar triangles.
Links
- Interactive animations
- Applets: a | b | c | d | e
- All five Geogebra files
- All four Cabri files
- Worksheets (but read the Teacher Notes below first!)
- Jarring Discoveries (in Algebra: Themes, Tools, Concepts, grades 8-10)
- Doctor Dimension (Precalculus)
- Make These Graphs (Precalculus)
- Lessons inspired by Dr. Dimension: Window Shades, by Rachel Chou (Precalculus)
- Doctor Dimension (Calculus, TI-83/84)
- Doctor Dimension (Calculus, TI-89)
Teacher Notes
General
The main point of the Doctor Dimension activities is to trigger conversations and reflection about rate of change, by defining a function in a visual context. Along the way, other questions will surface.
One way to use this context is to start by projecting the applets, or have students interact with them on their own devices, and to have an extensive discussion of them before handing out any worksheets.
Here are some of the questions that can be discussed at all levels in grades 8-12 while interacting with the applets.
- As the height increases from 0 to 16:
- How does the function change when the height reaches 8 units?
- Where is the rate of change constant? Why is it?
- Where does the rate of change gradually increase? Why does it?
- Where does the rate of change gradually decrease? Why does it?
You may follow up with one of the worksheets.
Grades 8-10 (and beyond)
In grades 8-10, you can have students work on Jarring Discoveries #1-7. Since they are only graphing individual points, and the areas can easily be figured out for whole-number values of the height, this is quite accessible. One key idea is recognizing linear graphs, and what makes them so.
Note that #8-11 are much more difficult.
For more examples of piecewise functions at this level (with no geometry), see Parking Rates, Comparing Cell Phone Plans, and Comparing Car Rentals
Precalculus (and beyond)
The discussion of rate of change at the precalculus level should include "concave up" vs. "concave down". A good way to take the discussion of linear, vs. concave up, vs. concave down further is to follow up on the first four applets by having students try to use the fifth applet to create vessels that will yield these graphs. Here are Rachel Chou's solutions. (Other solutions are possible.)
At this level, you may ask students to figure out formulas for the piecewise functions. This is difficult for the nonlinear parts of the graph, as it requires using a fair amount of both geometry (similar triangles) and algebra. Many if not most students will need help with this. I used this activity as a Day 1 lesson in Precalculus, in order to set a serious tone to the class and to promote perseverance. (The prerequisites are pretty basic, but thinking is required!)
The worksheet suggests that students check their formulas by trying heights for which they know the amount of liquid. That is indeed preferable to using the applets, but the applets do provide an additional check.
For another precalculus-level lesson on a piecewise function, see Graphing Square Roots.
Calculus
At the calculus level, the key additional question is what happens when the height is 8. Is the function continuous? Is it differentiable? This can be discussed initially when studying the applets (both the geometry and the graphs,) and again when the formulas have been figured out. In cases where the function is differentiable everywhere, you may also discuss any points of inflection.
If you have TI-eighty-something calculators, the worksheets include a little bit of programming to get the rate of change to the left and right of a given point. This makes it possible to discuss differentiability numerically. Do this in addition to, not instead of making the connection with the figure. The latter will help students attach a meaning to the former.
When appropriate, you may discuss the relationship between the Doctor Dimension model and integration. (Basically: it is integration!)
